Reduction and avoided emissions analyses require a lot of processing to compute so may take some time to run - this is normal behavior. For this reason, we run them asynchronously to allow you to continue navigating while the report runs and send a notification e-mail when it is complete.
Reduction evaluation
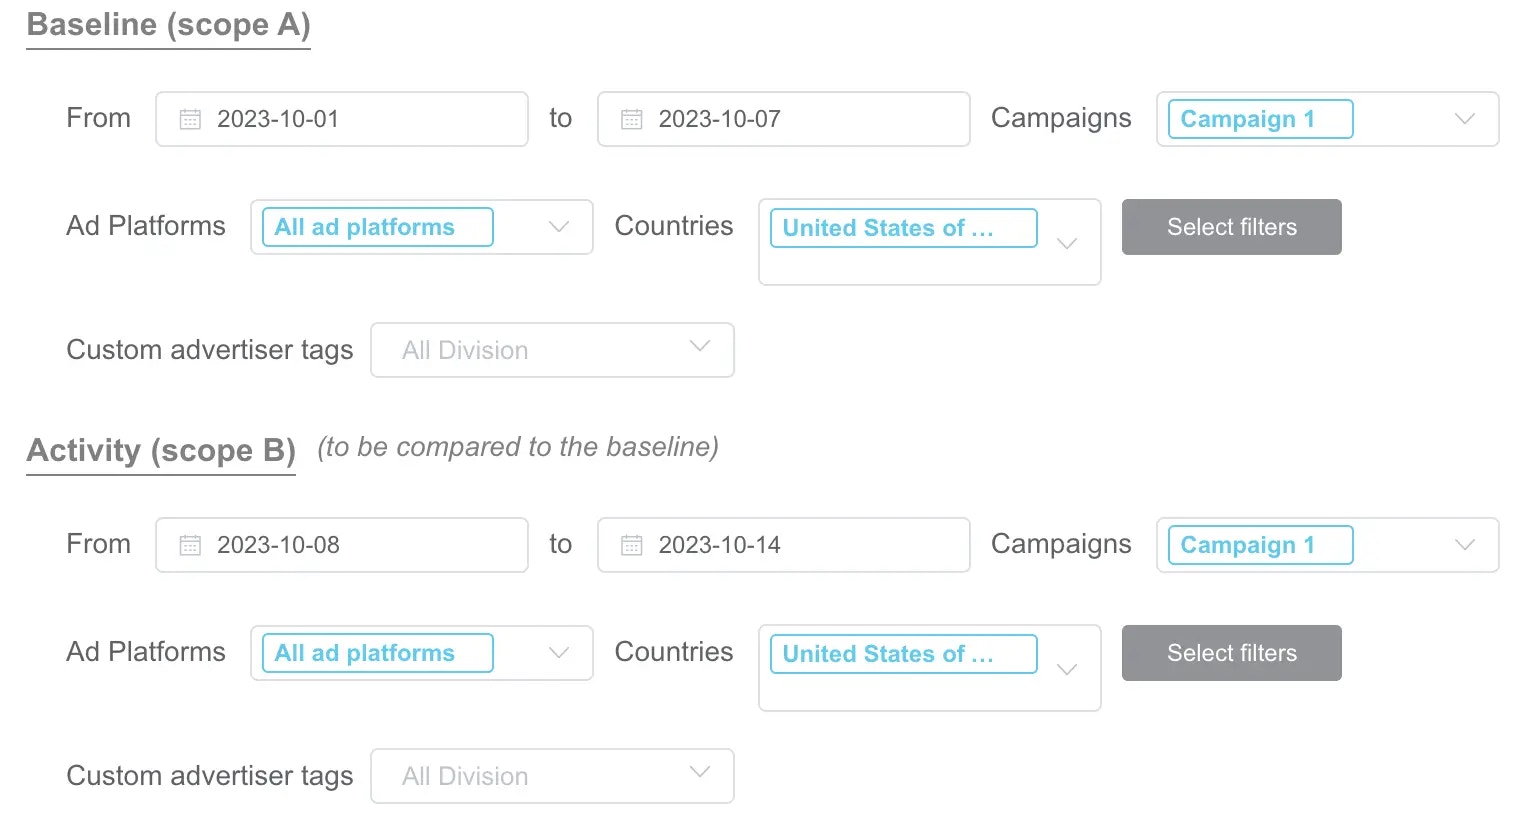
There are 2 broad use cases for reduction evaluation although our tool allows for evaluation of any two scopes to be defined and compared. Reduction:- On a macro level - Looking at one scope vs. a baseline to determine the overall reduction (can be done by brand, country, platform etc)
- On a micro level - Assessing the impact of an optimisation to determine the reduction associated - A|B testing, best practice effectiveness
Avoided emissions
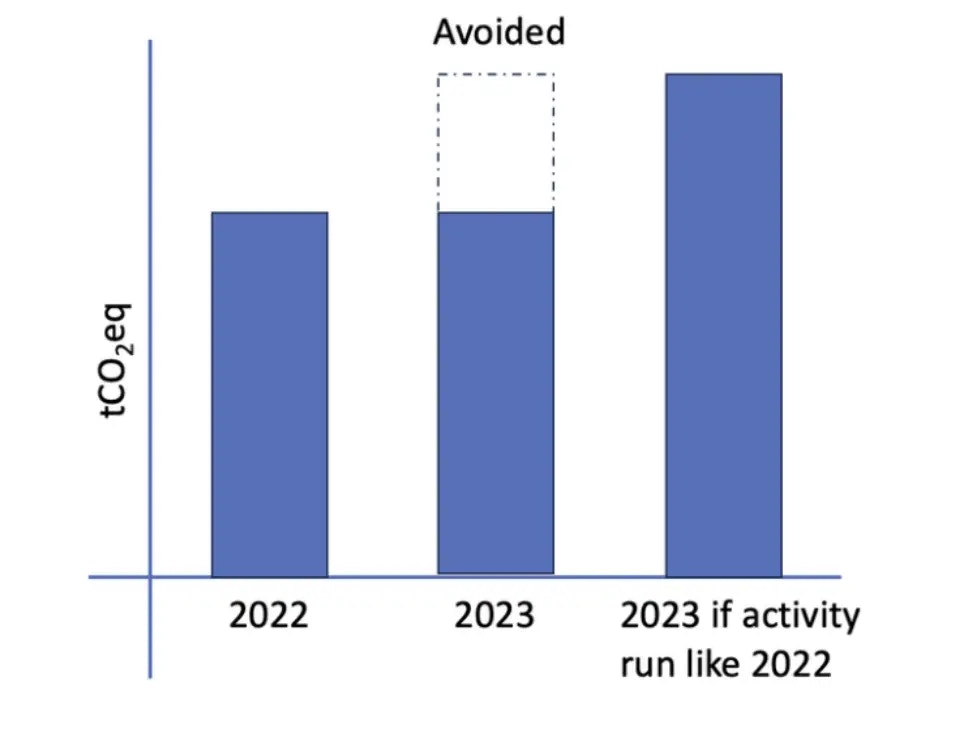
The main use case for avoided emissions is:- On a macro level - Assessing the collective improvement from your activity when other factors like increased budgets or activity mean that reduction is either not shown or minimized
Reduced and Avoided emissions definitions
Reduced emissions looks at the reduction of emissions in absolute terms between two scopes. For example, from 2022 to 2023, if you produced 100tCO2eq in 2022 and 80tCO2eq in 2023, you have reduced emissions by 20%.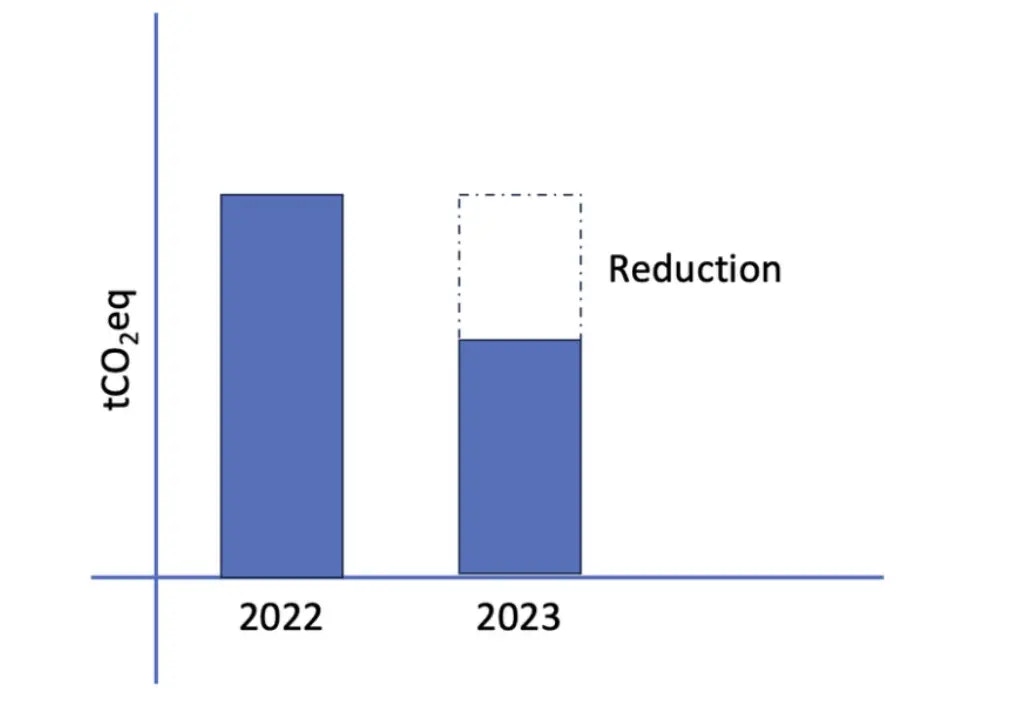
Avoided emissions are emissions that would have been generated, but weren’t due to improved inputs or processes. Let’s say in 2022 you generated 100 tons of CO2eq. In 2023, you implemented a number of best practices but also doubled your output/number of clients. As a result, you’ve generated 150 tons of CO2eq. This means that there has not been a reduction, however, in order to help quantify how much CO2eq you would have created, we can run a simulation where we use 2022 as a baseline to determine how many emissions would have been created if you hadn’t put in place better practices. If this number is now 200 tCO2eq, then you will have 50tCO2eq avoided emissions.